Stavario is a bit more complex
Do you want to have a clear overview of activities on your construction sites and their time planning?
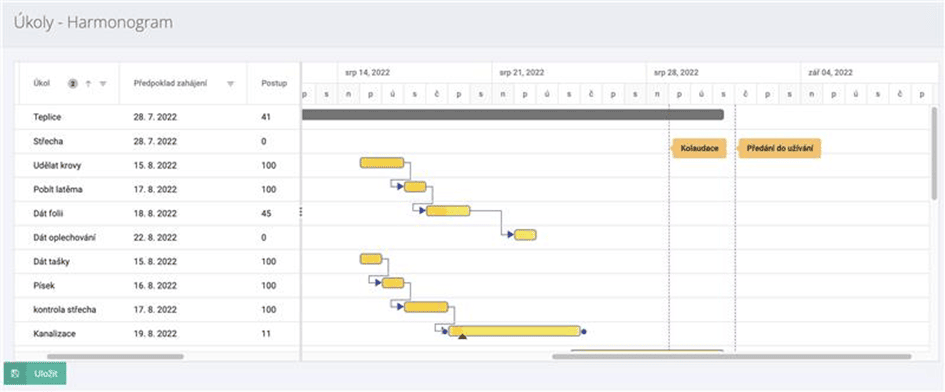
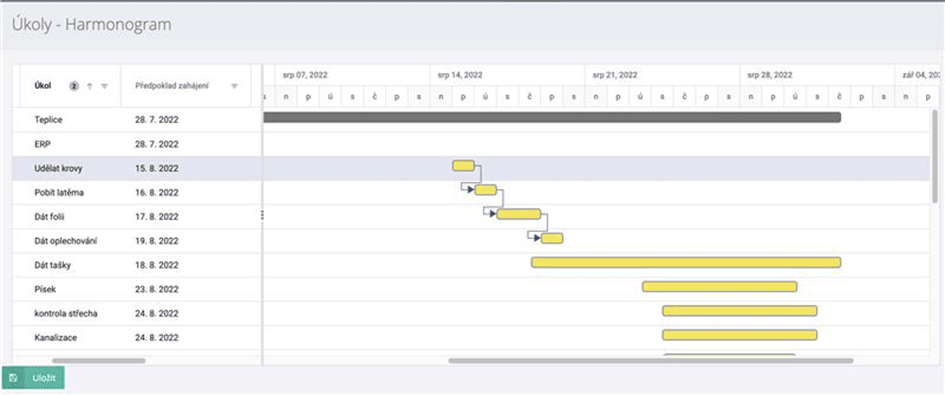
Use Stavario and the Gantt chart linked to the tasks module. Thanks to this function, you can easily visualize all activities and tasks in real time – their beginning, progress, follow-up and end. All in one app and in one place.
The new modern IKEM pavilions will house a common emergency room, an ARO department, a cardiology, metabolic and angiology intensive care unit. Photo: ikem.cz
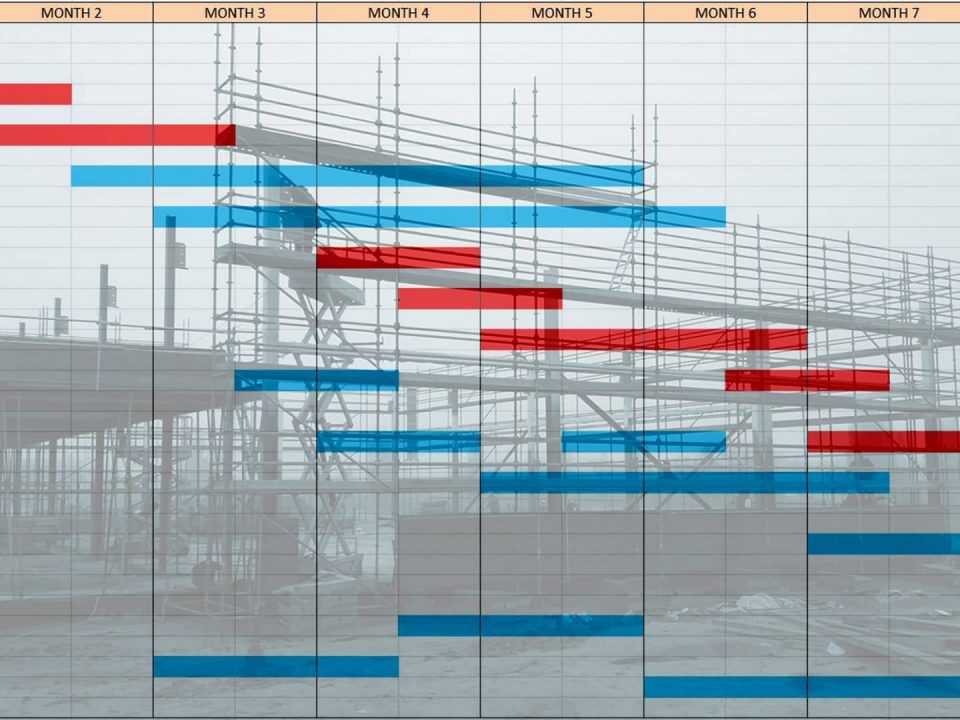
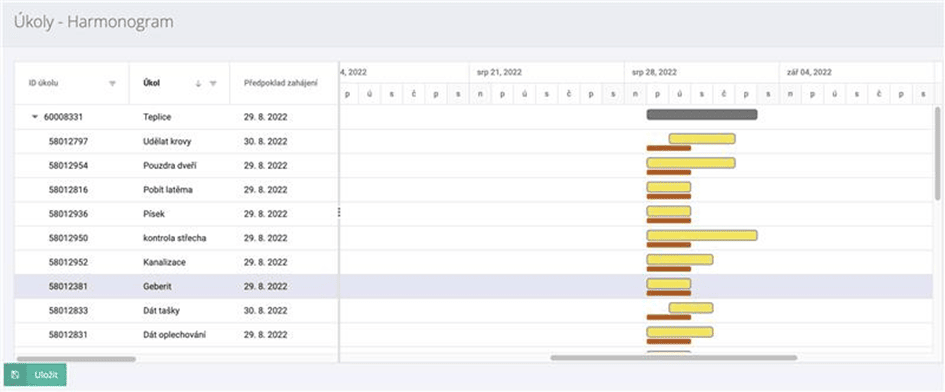
Experts know that it is important to properly plan the implementation of any project. Proceed according to the plan and supervise its compliance. Do you know how it was at the beginning, how it changed from the assumption and how it will affect the associated works? Now yes. Create a plan for your project and compare it with the actual work done. Can you learn from past experiences and apply them to the present? Thanks to the Gantt chart, you can.
Photos can be uploaded to Stavaria from a mobile phone directly on the construction site.
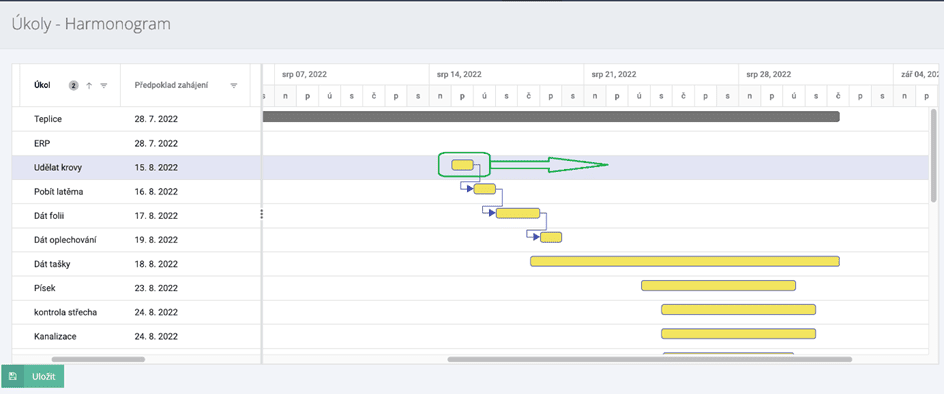
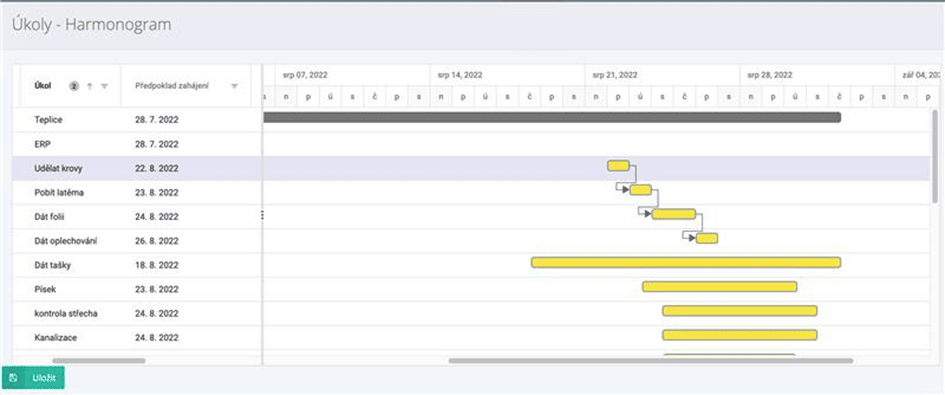
Has it ever happened to you that you planned 10 subtasks for the main task and then the deadline for 3 of them moved and you spent hours redoing the schedule? Hours you needed to spend elsewhere and differently? With the Gantt chart, you work efficiently with the links between individual tasks. In practice, this means only one thing: whenever the date of any activity changes, you simply change it in the diagram and the other follow-up work is automatically rescheduled by itself. Use modern tools that make your work easier by automating planning.
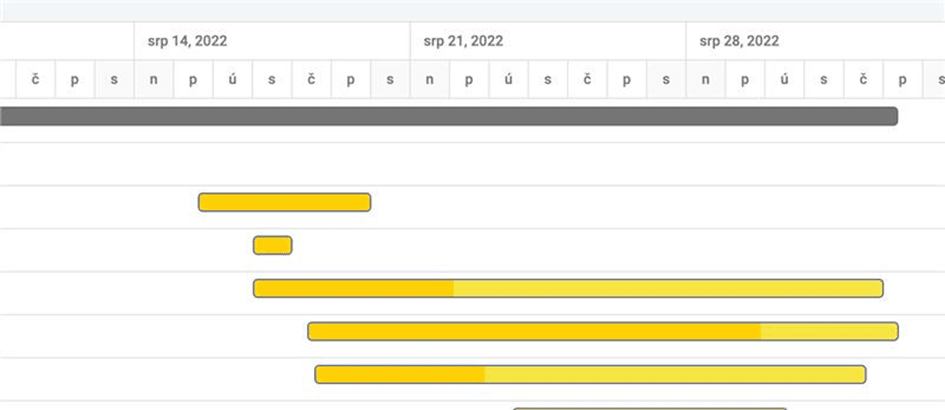
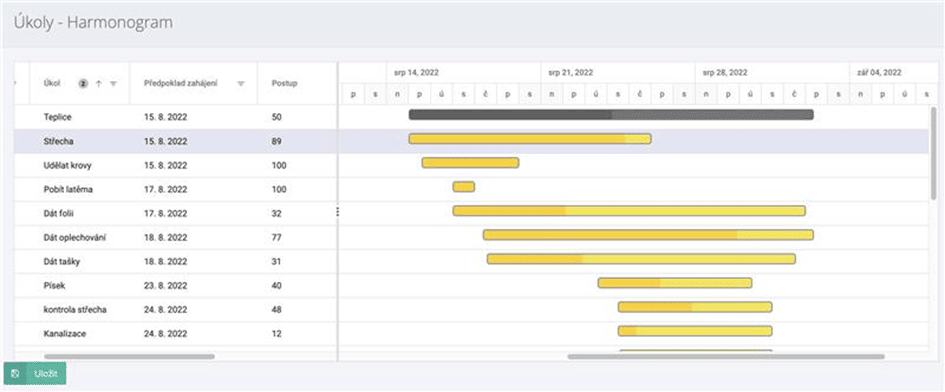
You know that you have already done a lot of work, all the tasks are in progress, and then an investor comes with the question: "How are we doing?". Instead of giving him a lengthy description of the progress of individual activities, show him the status of the work in a diagram. In just a few moments, you'll see how you're doing in terms of commitments and deadlines.
Do you have a problem with the time planning of individual activities and tasks on construction sites? Have you ever missed a deadline because you forgot something? Use time planning in the Stavario system schedule and stay one step ahead.
